Advanced examples
This chapter contains a number of more advanced examples, based on the content of the previous chapters.
Displaying a chart with Chart.js
Displaying text is useful but charts provide valuable information as well. To help us create charts in combination with AlpineJS we can use another library called Charts.js. Self-described as: "Simple, clean and engaging HTML5 based JavaScript charts. Chart.js is an easy way to include animated, interactive graphs on your website for free."

Similarly to AlpineJS, Charts.js uses a single <script>-tag to load in the library:
<script src="https://cdn.jsdelivr.net/npm/chart.js"></script>
A chart with hardcoded data
Following that we can start building charts on our pages. For this example we will be using a simple line chart. From the documentation we see that first of all the chart is based on a setup of two parts of data:
- a variable called
labelswhich holds the x-axis labels. - a variable called
datasetswhich is an array holding objects, each containing:label: label of the datasetdata: an array holding the actual data of the datasetbackgroundColor: the color of the dots on the line inrgb(x, x, x)borderColor: the color of the line itself inrgb(x, x, x)- and more if needed...
To get all of this data inside a <div>-tag like before we need to make a function in an additional <script>-tag to keep our file clean and structured. This function will simply return the variables holding data and the functions we need to use inside the <div>-tag.
For now this is:
chart: an empty variable that will hold a reference to the chart so we can later manipulate the chart itself. When the chart is created on the page this variable will be filled up.data: the data needed for the chart.
<html>
<head>
  <script defer src="https://unpkg.com/alpinejs@3.5.0/dist/cdn.min.js"></script>
  <script src="https://cdn.jsdelivr.net/npm/chart.js"></script>
  <script>
    let chartData = function () {
      return {
        chart: null,
        data: {
          labels: [
            'Jan',
            'Feb',
            'Mar',
            'Apr',
            'May',
            'Jun',
          ],
          datasets: [{
            label: 'My First dataset',
            backgroundColor: 'rgb(255, 99, 132)',
            borderColor: 'rgb(255, 99, 132)',
            data: [0, 10, 5, 2, 20, 30, 45],
          }]
        },
      }
    }
  </script>
</head>

<body>
    <div x-data="{chartData: chartData()}">
    </div>
</body>
</html>
Now we need to create the function that will use our data to render the chart on the page. This function will also be placed inside the earlier chartData function:
renderChart: function () {
          this.chart = new Chart(
            document.getElementById('myChart'),
            {
              type: 'line',
              data: this.data,
              options: {
                title: {
                  display: true,
                  text: 'Average daytime temperature in 2021'
                }
              }
            }
          );
        }
This function fills up the chart variable with a new chart. This chart is created using two parts:
document.getElementById('myChart'): this located the HTML tag where the chart needs to be created in. In our case this will be a<canvas>-tag in the<body>of our page:<canvas id="myChart"></canvas>- a JSON document holding the config data. In this case this is the:
- chart
type - reference to the variable which holds the
datato base the chart on - extra
optionssuch as a title, ...
- chart
We include both the <canvas>-tag and the function. And then include an x-init= directive to use the renderChart function:
<html>
<head>
  <script defer src="https://unpkg.com/alpinejs@3.5.0/dist/cdn.min.js"></script>
  <script src="https://cdn.jsdelivr.net/npm/chart.js"></script>
  <script>
    let chartData = function () {
      return {
        chart: null,
        data: {
          labels: [
            'Jan',
            'Feb',
            'Mar',
            'Apr',
            'May',
            'Jun',
          ],
          datasets: [{
            label: 'My First dataset',
            backgroundColor: 'rgb(255, 99, 132)',
            borderColor: 'rgb(255, 99, 132)',
            data: [0, 10, 5, 2, 20, 30, 45],
          }]
        },
        renderChart: function () {
          this.chart = new Chart(
            document.getElementById('myChart'),
            {
              type: 'line',
              data: this.data,
              options: {
                title: {
                  display: true,
                  text: 'Average daytime temperature in 2021'
                }
              }
            }
          );
        }
      }
    }
  </script>
</head>

<body>
  <div x-data="{chartData: chartData()}" x-init="chartData.renderChart()">
    <canvas id="myChart"></canvas>
</body>
</html>
At this point we have a functioning chart! 🎉
A chart with dynamic data
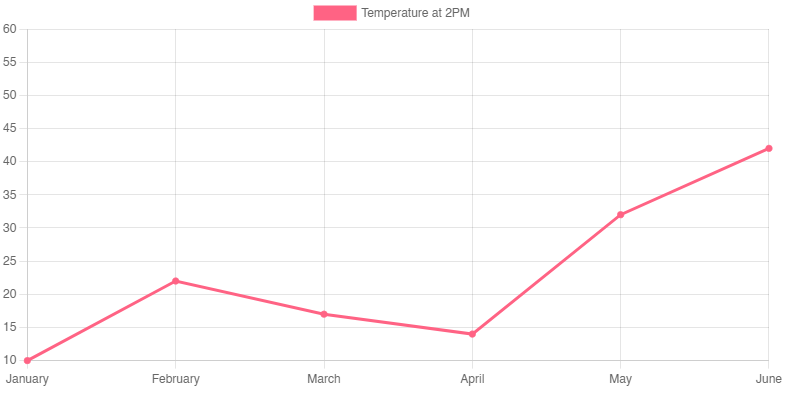
Usually charts do have data based on an external data source like an API. To do that we include another function that fills up the labels and datasets using data from a GET request and renders the chart:
fetch: function () {
          fetch('http://127.0.0.1:8000/temperature/dataset')
            .then(res => res.json())
            .then(res => {
              this.data.labels = res.months;
              this.data.datasets = res.datasets;
              this.renderChart();
            })
        }
This function will call an API having the following endpoint:
@app.get("/temperature/dataset")
async def root():
    return {"months": ['January', 'February', 'March', 'April', 'May', 'June'],
            "datasets": [{"label": "Temperature at 2PM",
                        "backgroundColor": "rgb(255, 99, 132)",
                        "borderColor": "rgb(255, 99, 132)",
                        "data": [10, 22, 17, 14, 32, 42, 57]
                        }]
            }
Note
Calling a localhost API from JavaScript like this will throw CORS errors. To solve this you need to do two things:
- Install an extension that hosts the
.html-file, such as the Live Server VS Code extension which hosts the file athttp://127.0.0.1:5500. - Use that IP & port combination to set up the correct CORS
allow_originsin the middleware of your API.
And use that data to fill up the chart labels and datasets we have cleared of hardcoded data:
data: {
  labels: null,
  datasets: null
}
To set it all in motion we need to include the fetch() in the x-init=:
<div x-data="{chartData: chartData()}" x-init="chartData.fetch()">
This all results in the following:
<html>
<head>
  <script defer src="https://unpkg.com/alpinejs@3.5.0/dist/cdn.min.js"></script>
  <script src="https://cdn.jsdelivr.net/npm/chart.js"></script>
  <script>
    let chartData = function () {
      return {
        chart: null,
        data: {
          labels: null,
          datasets: null
        },
        fetch: function () {
          fetch('http://127.0.0.1:8000/temperature/dataset')
            .then(res => res.json())
            .then(res => {
              this.data.labels = res.months;
              this.data.datasets = res.datasets;
              this.renderChart();
            })
        },
        renderChart: function () {
          this.chart = new Chart(
            document.getElementById('myChart'),
            {
              type: 'line',
              data: this.data,
              options: {
                title: {
                  display: true,
                  text: 'Average daytime temperature in 2021'
                }
              }
            }
          );
        }
      }
    }
  </script>
</head>

<body>
  <div x-data="{chartData: chartData()}" x-init="chartData.fetch()">
    <canvas id="myChart"></canvas>
  </div>
</body>
</html>

